CampusLife II
Analyse emotional self-report behaviour through smartphones

Introduction
In Spring 2016, Georgia Tech executed a 1 month study to determine if mental health and academic performance could be correlated, or even predicted, through a student’s digital footprint. The data collected from the study along with follow up studies with participants brought to light many pitfalls of the deployment. Due to which it was necessary to understand why these problems occurred and how we can mitigate these.
Since most of this chunk of work has been submitted as a paper and is under review, this piece is going to be a discussion of some of the interesting explorations that are not being published. Most of the following content is focussed around the responses we received through the Ecological Momentary Assessment probes we used to understand a participant's mental health.
It is recommended that one refers to the first leg of CampusLife before proceeding.
My Role
In this leg of the project I was predominantly working alone. My work was primarily guided by Gregory Abowd and involved consultations with some of the other PIs and students from the larger effort as well.

Analysis
Since one of our methods of capturing data was self-report, we decided to use a lockscreen based method that would reduce the user burden. Thus, the active stream of data we acquired was purely based on micro-interactions.
Later, focus groups revealed to us that the intent behind many of the responses was not necessarily to answer the question asked but to continue onto their primary task, i.e. unlocking their phone. This is typical issue that will arise from the use of an interaction that is very simplistic and natural.
My major motivation during this phase of the project was to understand from the data, why participants behave a particular way; especially why we can't elicit a true/legitimate response, but only a quick/convenient one.
I specifically focus onto the responses on the PAM questions, which are meant to understand a participants mood or affect through a micro-interaction where the participant selects the image that resonates the most with them.
Photographic Affect Meter
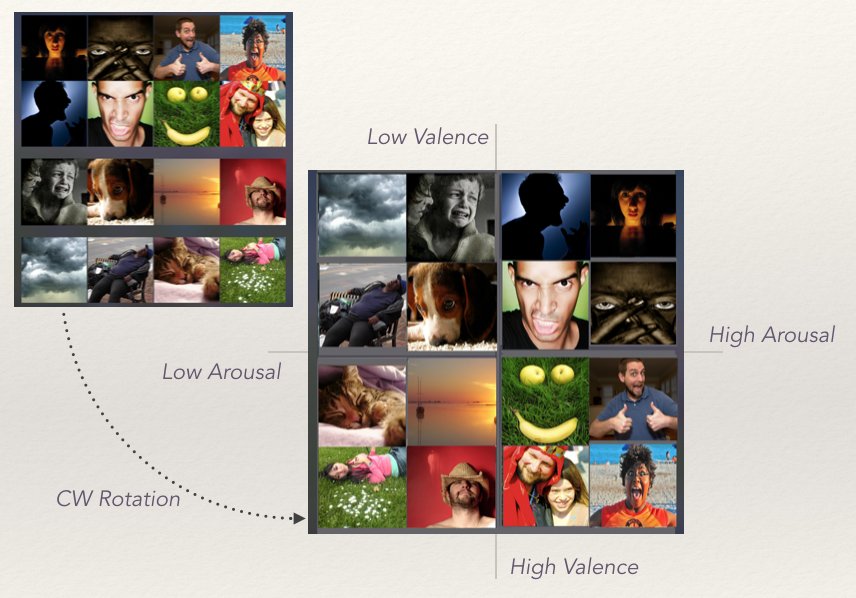
PAM is a tool that translates Russell's Circumplex Model of Affect into a 4x4 grid with 16 images. Each grid position represents a particular mood, that is determined by its horizontal (valence) and vertical (arousal) coordinates.
This sort of probe can pushed to a participant in multiple ways. A notification is one type, a pop-up is another. The method we employ is the lockscreen. Stitching PAM with micro-interactions helps reduce the recall-bias and samples a participants mood in the moment (or close to it).
 PAM interface
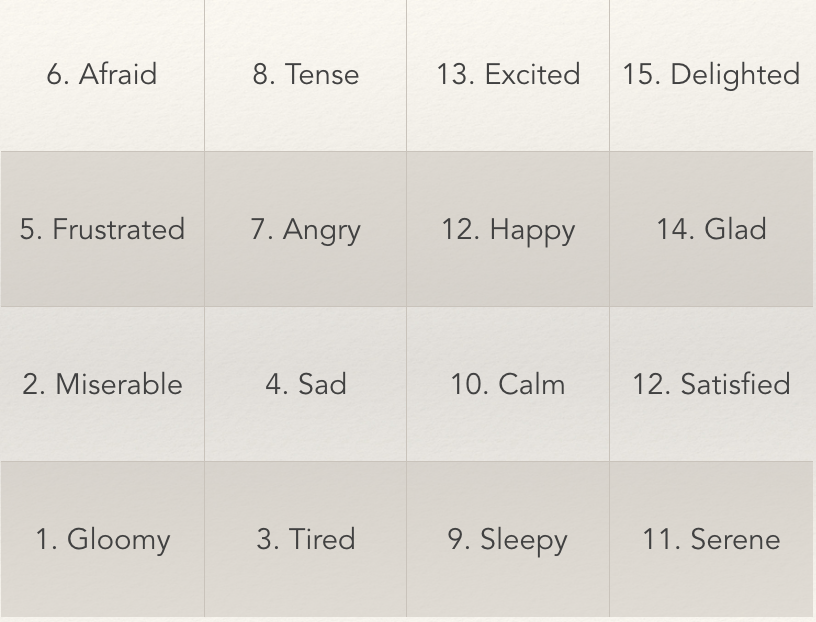 PAM score mapping
Responses
The PAM responses can be be characterised by 16 different emotions. For a given participant, any response can at best reflect the emotion they want to express externally, and may or may not be an accurate representation of how they feel internally.
From the responses we have received, a given participant may be predisposed to feel a certain set of emotions. This could potentially tell us about the participant's emotional state. However, it could also be the case that it reported emotions are motivated by other factors such as ease of selection, "safe" responses based on the perception of others and quite simply misunderstandings.
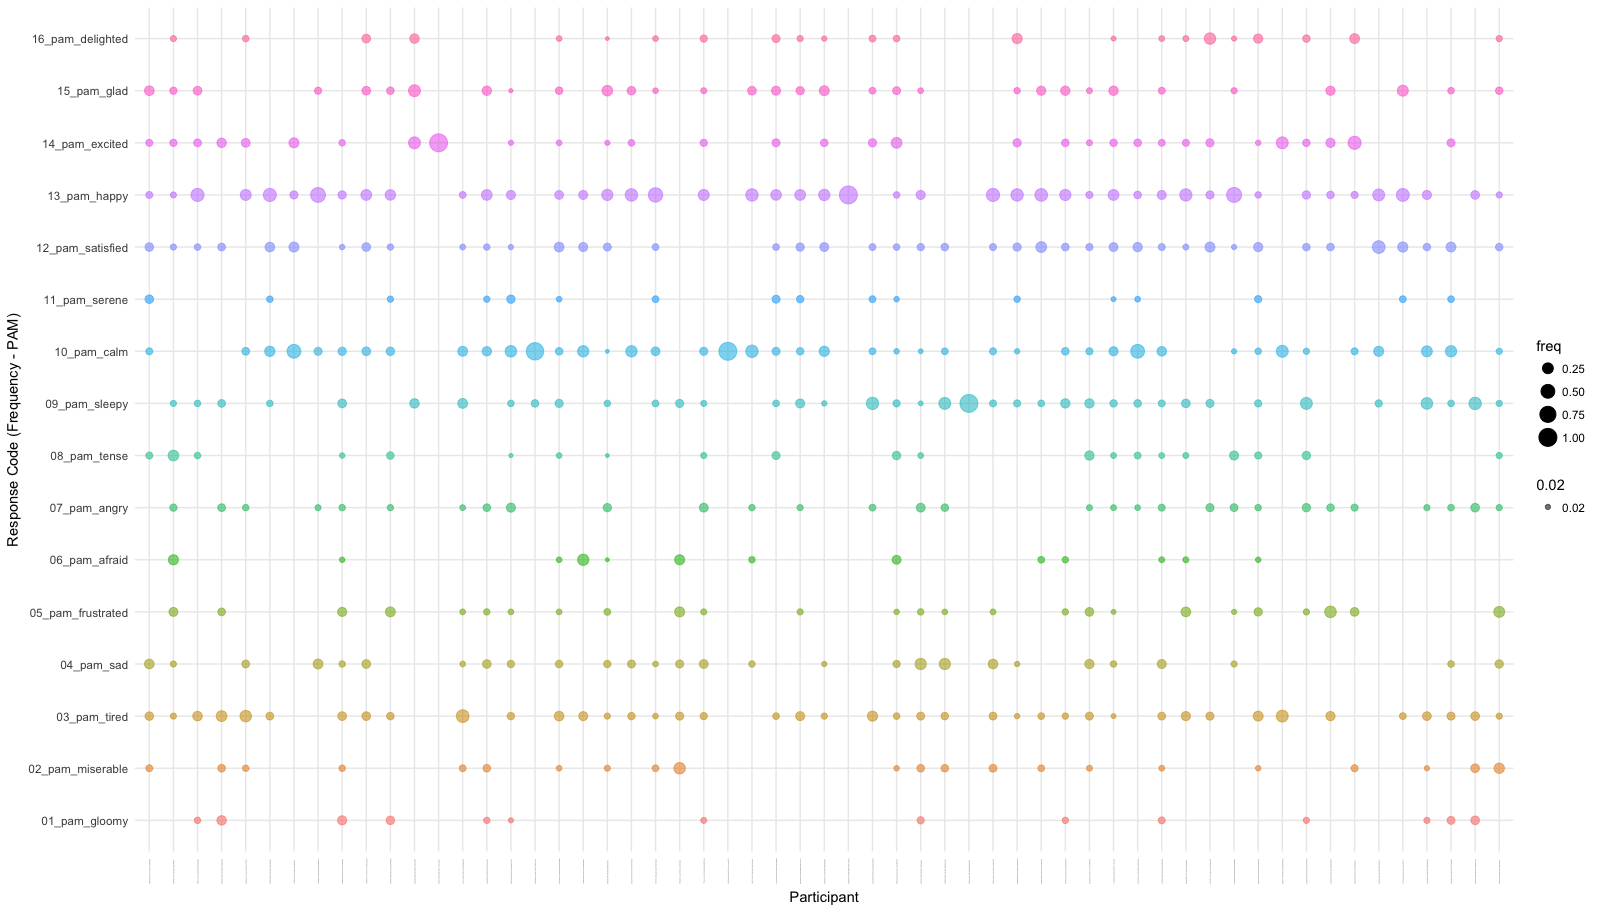
The bubble plot above is an aggregated representation of how the participants responded. To interpret the above graph:
- Each column depicts how a given participant responded - Each colour denotes an emotions they reported.
- The radius of the bubble depicts how often a participant responded with that given emotion.
- Each row depicts how often a given emotion was reported by a participant.
On eyeballing the plot above it would be evident that certain participants respond with very fixed set of emotions. While certain emotions are relatively less popular amongst all responses.
Although it is possible that this could be a true representation of the participant's emotional state, the focus group interviews led us to believe that this sampling through EMAs is not free of errors.
Discussion
Thematic Annotation
From our focus group responses we learnt that interpretation of the images may not necessarily match the mood from the circumplex they are mapped to. In certain cases it is possible the participant was inlcinced to select an image based on the subject of the image, as opposed to resonating with the affect of the image. For e.g. someone picked the image with the puppy, when they were confused what to select. Interestingly enough, pictures with dogs appear across multiple emotions.
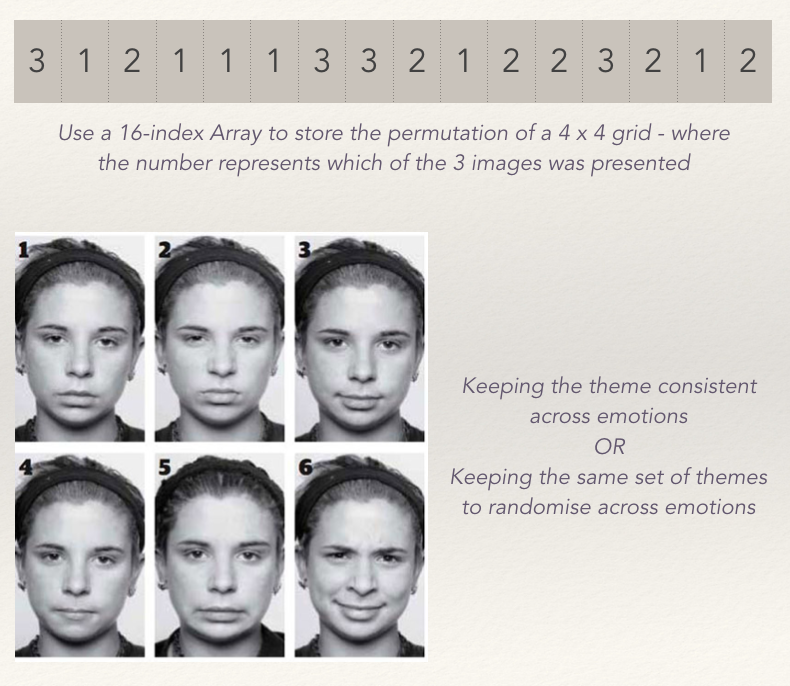
To understand this behaviour we decided to annotate the images based on their themes as opposed to an emotion. It's important to note that the standard 48 images used for PAM, 3 for each of the 16 emotions, are selected based on public search results on querying the emotion itself. This does not control for other factors, for example colour, saturation, etc.
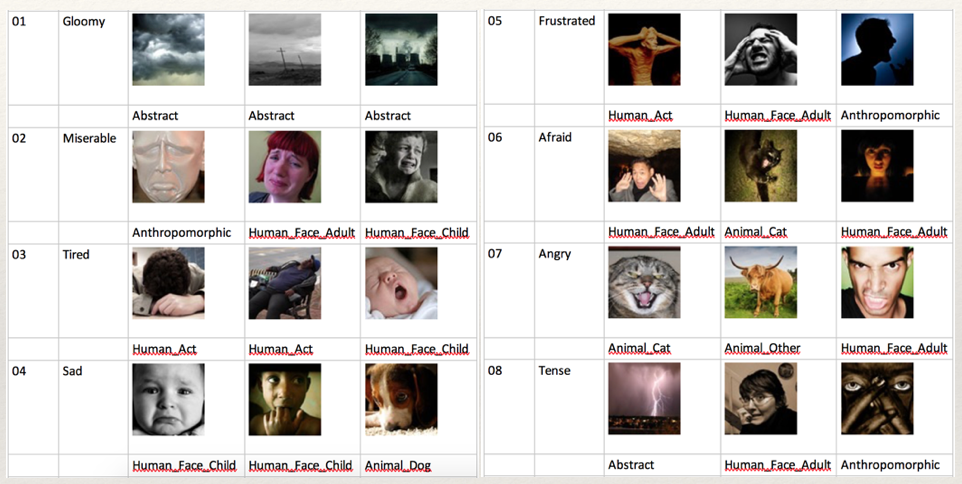
In total we use 4 broad themes. Some of these themes have other sub themes based on variations:
- Human: This includes images with humans as subjects and can be divided into Human_Act, which is for a human doing an acitivity, and Human_Face, which predominantly involves a human face. The latter is further divided into Human_Face_Adult and Human_Face_Child
- Animal: This includes images with animals as subjects and can be divided into Animal_Cat, Animal_Dog and Animal_Other.
- Anthropomorphic: This includes images with subjects that look like humans, but don't actually include humans in them.
- Abstract: This includes images with sceneries, objects and other miscelleneous subjects.
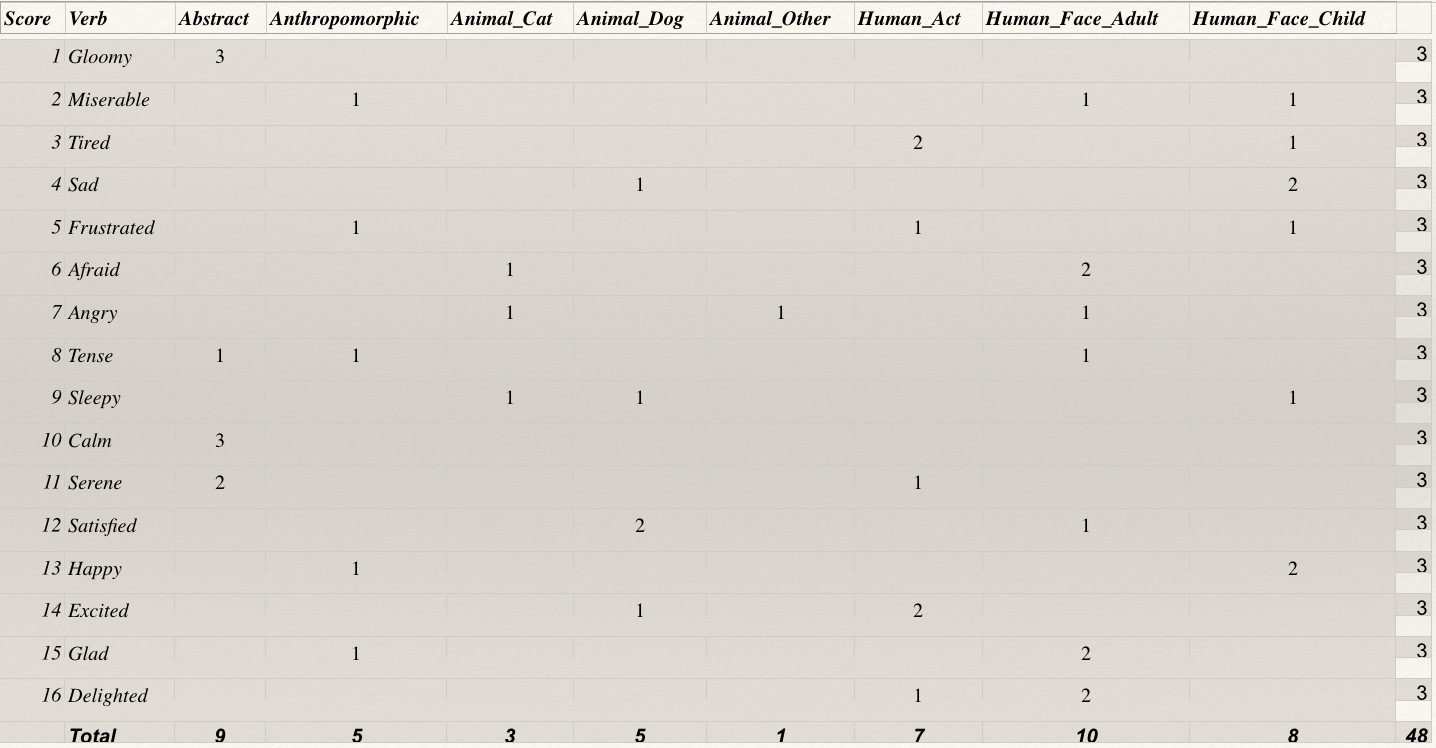
The matrix plotted above shows how the emotions are distributed across the different themes. This in itself brings to light a major issue with the images selected for PAM. As one can notice from the matrix, the themes are not equitably distributed across the various emotions. Therefore, if a participant was biased by the theme of the images, it is possible they overlooked the emotion it represents. Let's explore this with two cases:
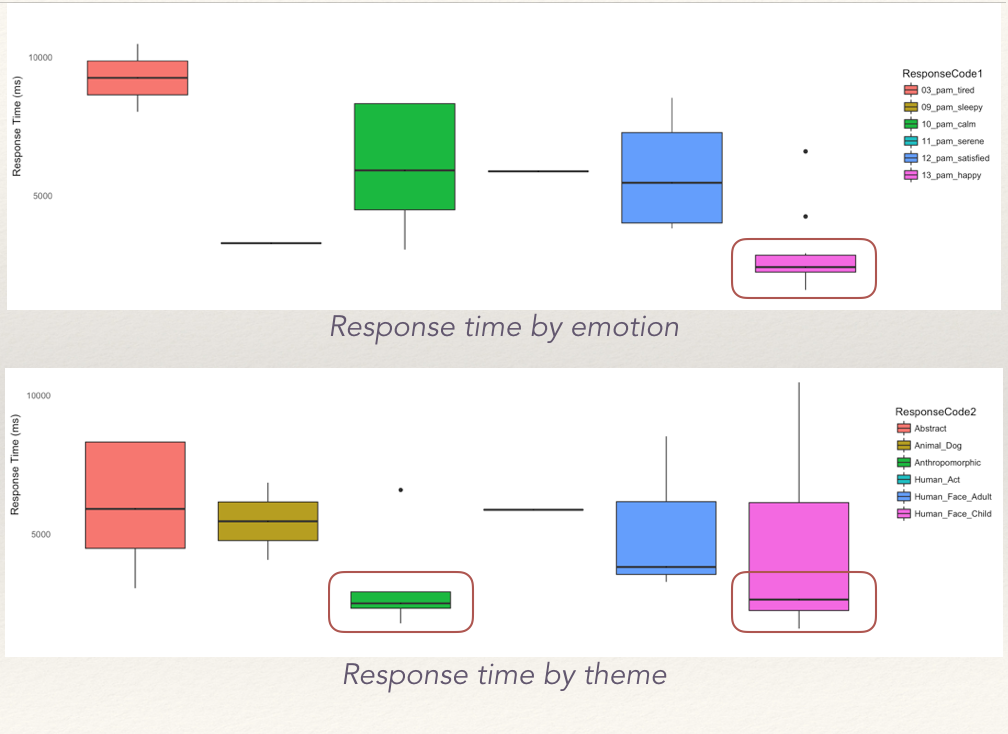
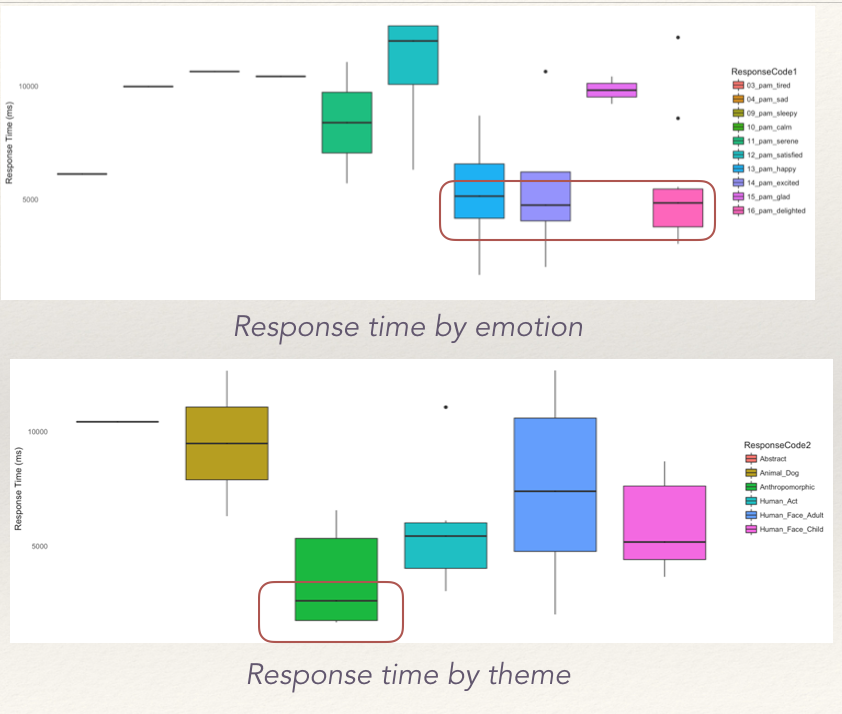
Controlling for thematic variations is probably the best way to clear these ambiquities from the data. Currently, we are also unable to tell, which other images appeared on the grid, when a participant picked a given image. It is entirely possible, that the selection of the image to depict affect could be a relative choice.
Ergonomics
Modern phone design and screen sizes influence how questions are presented to the participant. This could make certain response options easily accessible to participants - the top-left quadrant of the PAM grid would be the hardest to reach for a right-handed participant.
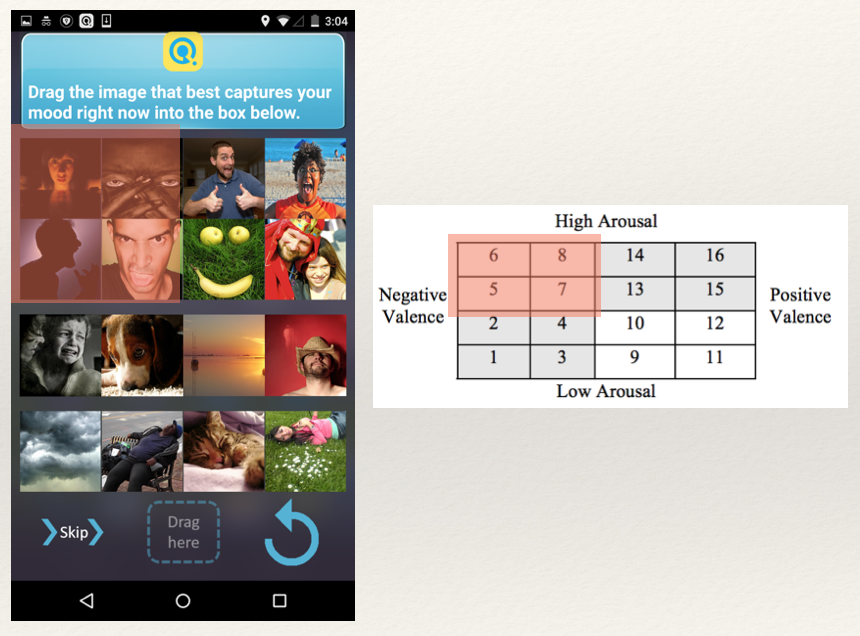
Participants who’s responses show an inclination toward’s a specific quadrant of the grid, in terms of speed or frequency, can be used to debate the factor of ergonomics. The responses inherently could burden the user to respond. In the case of PAM, the top-left quadrant is also the High-Arousal and Negative Valence zone. These are options participant might find difficult to express or even think of in terms of their perception of themselves. Thus it's again difficult to determine why certain options are ignored.
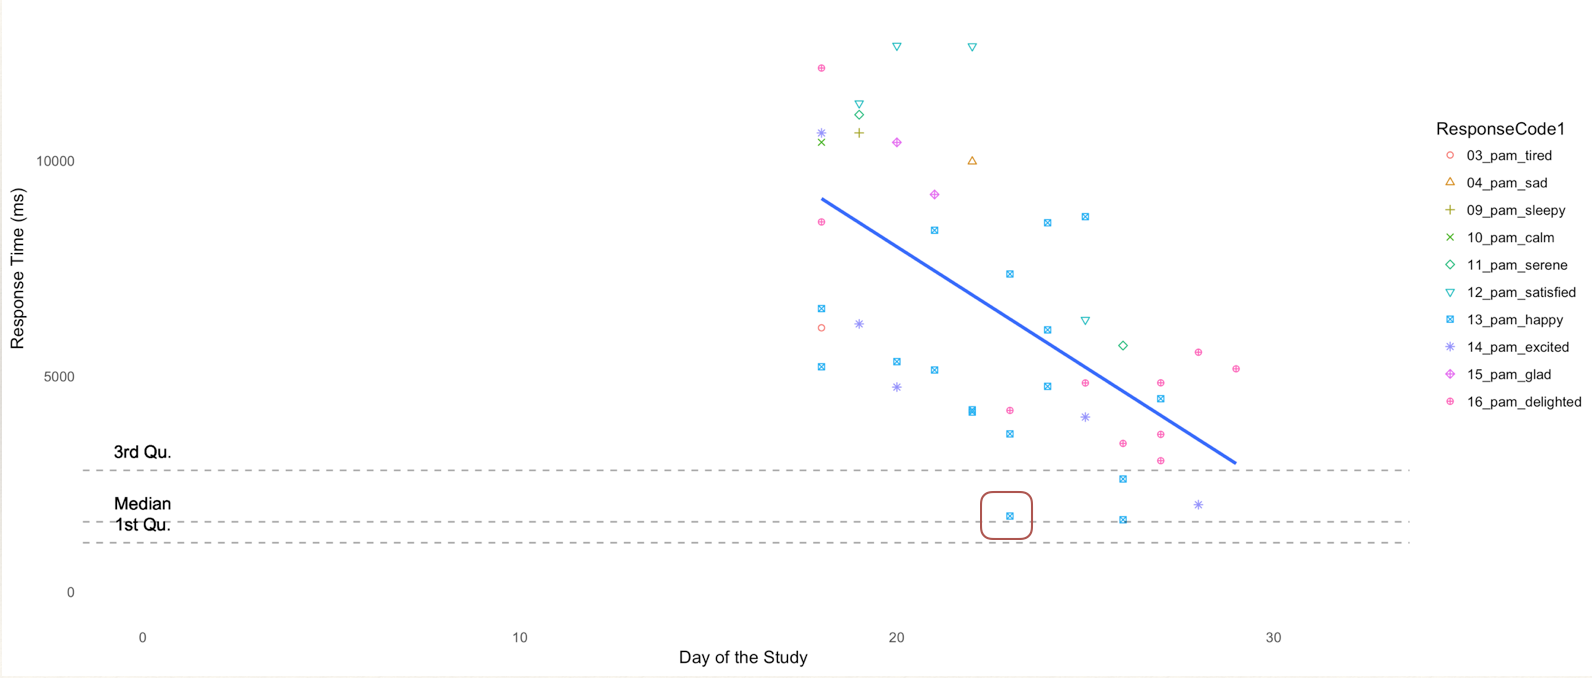
Response Speed
In a long study like the one this data is collected from, one would expect the response speeds of the participant to improve as they become more comfortable with the interface as well as the type of questions. However, there may be cases when participants begin with really quick responses only to slow down later when they take time to consider the question better, and eventually pick up speed again.
Interestingly enough, the speed of the response can explain the behaviour of a participant in terms of how they respond to questions.
Suggestions
Based on the different confounds we have discussed, there are certain suggestions we can recommend to control the self-report of mood through an instrument like PAM.
In the case of radial arrangements a means to eliminate the factor of ergonomics would be to change the orientation/arrangement of the responses. If ergonomics is a factor, then the most common responses or the quickest responses would belong to the same region irrespective of what the response is. The consequence of this method is that it disrupts standard user experience and might effect comprehension. An analog for this would be the use Likert scales in different directions in the same survey
Maintaining a consistent theme that can represent multiple emotions is ideal. This would entail finding a single visual that has multiple variations, each of which depicts a different emotion.
The alternative to this would be to distribute the themes across different emotions equally so that the subject of the image is not biasing. Therefore if there is an animal depicting "delighted", there should be a similar animal depicting "anger".
Conclusion
Bogus responses can occur due to multiple reasons such as lack of interest in the study or challenges in engaging the user. This can lead to reckless responses or even lack of variability in responses - i.e. picking from a fixed safe set of responses, that don't necessarily reflect the participants emotions.
It is important to note that a multitude of factors can effect a participants response behaviour:
- Participants are willing to convey certain moods more readily as opposed to others
- Certain images are more “attractive” or "distracting" and tend to interfere with the true respone
- Design of PAM EMA interfaces although reduce burden, they are not necessarily without its faults.
Ecological Momentary Assessments are extremely useful for user research, but when dealing with nuanced subjects like emotions, many of the assumptions traditional EMAs have need to be checked, reevaluated and controlled.